
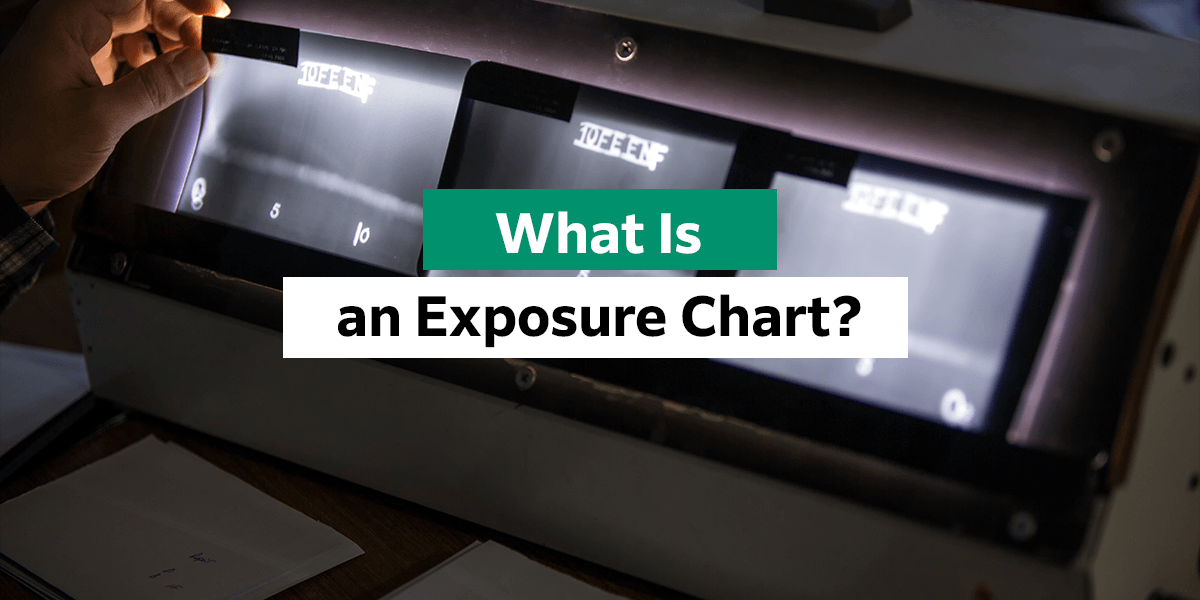
What Is an Exposure Chart?
Non-destructive testing (NDT) is critical for many industries, allowing manufacturers to conduct an in-depth analysis of materials and components without the additional cost of pushing them to failure. Through NDT, aerospace, automotive and oil and gas manufacturers can identify minor faults in critical components. With this crucial form of testing, maintaining safety is considerably more manageable.
NDT technicians conduct various tests on different components and materials. One test, radiographic testing (RT), uses X-rays or gamma rays to examine the internal structure of the relevant components, identifying flaws and defects without putting the equipment under pressure. Exposure charts are integral to this type of testing, making the process more efficient and the results more reliable. Understanding and interpreting these charts is essential for any radiographic test, as it allows you to start with as much information as possible.
Exposure Charts Explained
Exposure charts are like roadmaps for NDT technicians conducting radiographic testing. They provide critical information on equipment settings so technicians can get clear and accurate images. Working with exposure charts helps technicians ensure the test materials are suitable for use, test for flaws accurately and put the necessary safety measures in place.
Each exposure chart varies based on the equipment, test materials and industry regulations. NDT technicians may have to adjust machine settings to maintain compliance and ensure accurate and reliable results. The chart takes factors like material thickness, type of radiation and film type to help you adjust your equipment for the best results. A well-constructed exposure chart can significantly reduce the likelihood of errors in NDT inspections, contributing considerably to safety and component quality.
Why Are Exposure Charts Important in Non-Destructive Testing?
The purpose of NDT is to ensure component safety and reliability without damage. In many industries, even the slightest flaw can put lives at risk. Exposure charts are crucial to the NTD process as they provide valuable guidance for technicians, including determining the correct settings, radiation levels and exposure times for each test material. With an exposure chart, you can avoid producing unclear images, overlooking defects and exposing yourself to unnecessary radiation.
Traditional radiography settings were often established by looking through previous test settings to find a component of a similar size and using that setting. Without a proper roadmap, NDT technicians used equations to calculate the correct kilovolt (kV) and milliamperage (mA) settings. Having an exposure chart saves time and money. It’s easy to read and understand and prevents the waste associated with unusable films or unclear results. An exposure chart will determine your starting exposure, and you can refine the testing process from there.
In short, exposure charts are essential to providing consistent results and limiting the number of necessary exposures. Both factors are crucial to remaining profitable and ensuring technicians’ safety by reducing their exposure to unnecessary radiation.

The Components of an Exposure Chart
Every exposure chart in NDT consists of critical components to help you set up your equipment effectively for various inspections. Each element plays a crucial role in determining the exposure settings for the inspection. Adjusting them in each exposure chart assists in obtaining precise and reliable results during NDT inspections. Some standard exposure chart components include:
- Material thickness: The thickness of the test material determines the amount of radiation required to penetrate it and get an accurate picture.
- Type of radiation: The radiation used influences the image quality produced.
- Film type: The film or detector you use determines how the image is captured or displayed for analysis.
Maintaining accurate records and updating exposure charts is critical. Regular updates are particularly essential for boosting inspection reliability and efficiency. You can also use updated exposure charts to predict the quality of future images throughout testing. However, when compiling a composure chart, as many variables as possible must remain constant, including:
- Film focal distance
- Object film distance
- Film type
- Grid use
- Line mains composition
You may need several charts to detail film and screen combinations for different components.
When to Use an Exposure Chart
Use exposure charts in the NDT process whenever you need to determine component quality using radiographic methods. They guide you through the correct settings and techniques for each test. Use one while setting up your testing equipment for each inspection to ensure you conduct the testing process safely, efficiently and accurately.
Exposure charts are individual to each machine, meaning that even an identical machine needs a separate chart. All technicians should receive the appropriate training on using and interpreting exposure charts effectively to troubleshoot discrepancies and adjust settings accordingly. Exposure charts are often customized based on specific project requirements and industry standards. Technicians should use them before each test to ensure the settings match the components and intended test outcome.
Creating an Exposure Chart
While published exposure charts can streamline the testing process, creating charts is often necessary to boost efficiency and accuracy in each unique operation. Creating an exposure chart for NDT requires several steps, including:
Gather the Necessary Information
Before you start, collect all the necessary information, such as the material type and thickness, radiation source, film and detector type, and equipment calibration details.
Produce a Step Wedge
When you produce a new exposure chart, you need either a step wedge or a series of plates made from the test material in different thicknesses. The material thickness should increase incrementally — hence the steps in the wedge. Depending on the materials, increments can be between less than a millimeter to a few millimeters.
Measure the density of the steps with a densitometer and plot them on your preliminary chart. The densities you measure should be plotted graphically against the material thickness.
Draw a Preliminary Chart
A preliminary chart can help achieve more accurate density thickness results for the final exposure chart. It gives you an idea of the kV needed for a specific material thickness. Include other information on the filter, source-to-film distance, material, type of film and density. Your preliminary chart provides the data needed to prepare the final exposure chart.
Set up Test Exposures
Conduct test exposures on samples with known defects, and vary your exposure settings to capture a range of image densities. Note your results to log the optimal settings for each specific component.
Analyze the Test Results and Make Adjustments
Compare and evaluate the test images to determine the exposure settings that provide the most precise and detailed results for defect detection.
Create the Exposure Chart
Based on the test results, create a chart that outlines the optimal exposure settings for different material types and thicknesses,
Verify and Fine Tune
Validate your exposure chart through additional testing on different materials and thicknesses, adjusting the parameters as necessary.
Make Continuous Upgrades
Once you have implemented the exposure chart in your testing and trained other technicians on how to use and interpret it, update the chart with any further findings as you use it in testing to ensure continued accuracy in test results.
Enjoy Superior Quality in Your NDT Testing With FUJIFILM North America Corporation
Exposure charts can transform testing operations, streamline testing processes, optimize resources and reduce errors. If you’re an NDT technician, understanding and using these practical tools bring many benefits. However, exposure charts alone are a small part of the process. You also need the right non-destructive testing technologies for consistent, high-quality testing.
At Fujifilm, we have decades of expertise in pioneering innovative imaging products. We provide superior NDT image quality through revolutionary new film technology and our range of radiographic equipment. Our films incorporate unique speed and grain technology, allowing for use across various applications without compromising quality. Contact us to learn more and enhance your image quality today!